
The Figure of Eight Measurement of the Hand
- The figure-of-eight measurement test uses tape to measure the wrist joint.
- The edema in the hand may be easily measured with this technique.
- This test also captures the accumulation in the dorsal hand so that the circumferential tape measurements do not capture the measurement.
- This test is used in a clinic to examine the hand’s swelling and edema.
Table of Contents
What is the purpose of the Figure Eight Measurement of the Hand?
The edema, or swelling, over the hand, is measured using a figure-eight test on the hand.
Technique
When comparing tension-controlled measuring tape with standard tape, this method is approved
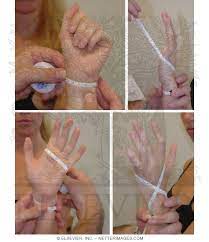
Step 1: A hand is placed on the table’s edge.
Step 2: Use the distal part of the ulnar styloid process as a starting point.
Step 3: Next, run the measuring device from the distal end of the radial styloid process over the anterior wrist.
Step 4: The tape is then brought over the hand’s back (dorsum), over the fifth metacarpophalangeal joint line, and diagonally (to the opposite side).
Step 5: The tape is then applied to the hand’s volar aspect, carried to the fourth metacarpophalangeal joints, and then diagonally across the hand’s dorsum (to the other side) to the beginning point (distal to the ulnar styloid process).
Step 6: Always match the affected side to the unaffected side.
The Figure of Eight Measurement of the Hand Video:
Evidence
For evaluating hand edema in burned patients, a figure-of-eight measurement approach is more accurate and dependable than a water volumetric measurement.
For assessing hand edema in patients with hand pathology, the figure-of-eight measurement method is a viable and dependable measurement instrument.
For testers 1 and 2, the figure-of-eight technique’s intratester reliability coefficients (ICCs) were 0.96 (SEM, 0.47 cm) and 0.97 (SEM, 0.41 cm), respectively.
The figure-of-eight measurements’ ICC for intertester reliability was 0.94 (SEM, 0.58 cm).
Concurrent validity’s Pearson’s correlation coefficient was r =.929 (p 001).


One Comment